Hydroponic EC Chart: Ranges by Plant and Growth Stage
Most growers learn about EC the hard way: they dial in their nutrient solution to the right number, then watch their plants struggle anyway. The chart is correct but something is still off. That gap between “EC looks fine” and “plants are thriving” is what this article covers, along with the actual reference numbers you need.
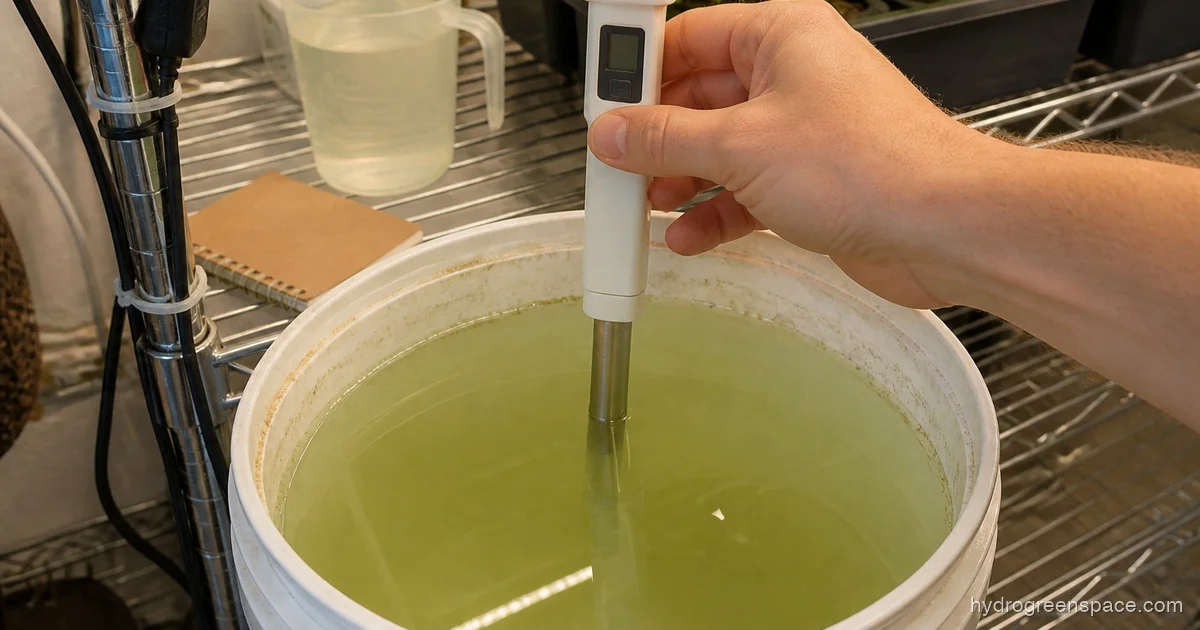
EC stands for electrical conductivity, measured in millisiemens per centimetre (mS/cm). It tells you how many dissolved salts (nutrients) are in your water. Higher EC means more nutrients; lower EC means less. Your nutrient solution conducts electricity in proportion to what’s dissolved in it, so an EC meter gives you a reliable, instant snapshot of nutrient concentration.
What EC does not tell you is which nutrients are present, whether your pH is right, or whether your roots can actually absorb what’s in the water. That matters a lot, and we’ll come back to it.
Hydroponic EC Chart by Plant Type
These are general ranges for mature plants in active vegetative or fruiting growth. Start at the lower end of the range when plants are young or when you’re dialing in a new nutrient formula.
| Plant | EC Range (mS/cm) | Notes |
|---|---|---|
| Lettuce | 0.8 – 1.6 | Sensitive to high EC; keep below 2.0 |
| Spinach | 1.8 – 2.3 | Tolerates moderate salinity |
| Kale | 1.25 – 1.5 | Light feeder; EC creep causes tip burn |
| Basil | 1.0 – 1.6 | Very sensitive; drops leaves above 2.0 |
| Mint | 2.0 – 3.0 | Hardy; handles higher EC well |
| Cilantro | 1.2 – 1.8 | Keep consistent; fluctuation causes bolting |
| Tomatoes | 2.0 – 4.0 | Fruiting stage benefits from higher EC |
| Peppers | 2.0 – 3.5 | Increase EC gradually into flower |
| Cucumbers | 1.7 – 2.5 | Sensitive to salt stress |
| Strawberries | 1.0 – 1.5 | Low EC throughout; drops quality above 2.0 |
| Beans | 2.0 – 4.0 | Robust; tolerates high EC |
| Peas | 0.8 – 1.8 | Keep light, especially early stage |
Leafy greens cluster at the low end (0.8–1.8 mS/cm) because they have shallow root systems and limited ability to manage osmotic stress. When EC is too high, water actually moves out of the root through osmosis rather than into it. The plant wilts even with a full reservoir. Fruiting crops like tomatoes and peppers sit much higher (2.0–4.0 mS/cm) because they need concentrated nutrition to support flowers and fruit development, and their more developed root systems can handle the osmotic load.
For NPK ratio for leafy greens, the EC range mirrors the nutrient demand: light feeders need less total dissolved solids, not just different ratios.
EC by Growth Stage
A single target number for the whole grow cycle is one of the most common mistakes in hydroponics. Plants need different nutrient concentrations depending on where they are in their life cycle.
| Stage | EC Range (mS/cm) | What’s happening |
|---|---|---|
| Germination | 0.0 – 0.4 | Seeds don’t need nutrients; plain or very weak solution |
| Seedling (week 1–2) | 0.4 – 0.8 | Roots just establishing; high EC causes seedling burn |
| Early vegetative | 0.8 – 1.4 | Ramp up slowly; leaves expanding |
| Full vegetative | 1.4 – 2.2 | Peak growth; match plant type chart above |
| Pre-flower | 2.0 – 2.5 | Transition; some formulas switch to bloom ratios here |
| Flowering/Fruiting | 2.0 – 4.0 | Depends heavily on crop; tomatoes push higher |
| Late flower / Ripening | 1.5 – 2.0 | Back off slightly; plant finishing, not building |
| Flush (final 1–2 weeks) | 0.2 – 0.5 | Plain or near-plain water; clearing residual salts |
Why EC Differs by Plant (It’s Not Arbitrary)
The ranges in those tables come from each plant’s native environment and osmotic tolerance. Lettuce evolved in relatively low-nutrient conditions and has a thin-walled root structure that’s easily damaged by high salt concentrations. Tomatoes, by contrast, are heavy feeders that developed in nutrient-dense soils and build extensive root systems capable of drawing from higher-concentration solutions.
Temperature also plays into this. At higher reservoir temperatures (above 22°C / 72°F), plants increase water uptake faster than nutrient uptake. EC appears to drop even though you haven’t added nutrients, because water is being absorbed and leaving the dissolved salts behind at a higher concentration. This is one cause of what growers call EC drift.
EC Drift: Why Your Numbers Keep Moving
EC drift confuses a lot of growers. You check the reservoir Monday and it reads 1.8 mS/cm. By Thursday it’s 2.3 mS/cm and you haven’t added a thing.
What happened: plants and evaporation pull water from the reservoir, but the nutrients mostly stay behind. With less water and the same dissolved salts, EC rises. This isn’t a problem with your nutrients. It’s basic concentration math.
The fix is simple: top off with plain, pH-adjusted water (not fresh nutrient mix) when EC rises. Only add fresh nutrient solution when EC drops below your target, which means plants are consuming nutrients faster than water.
Keeping a log of your EC readings across the week tells you which direction the reservoir is drifting and whether your current concentration is in balance with plant uptake. If you want to track this more precisely, a hydroponic nutrient calculator can help you calculate exact top-off volumes.
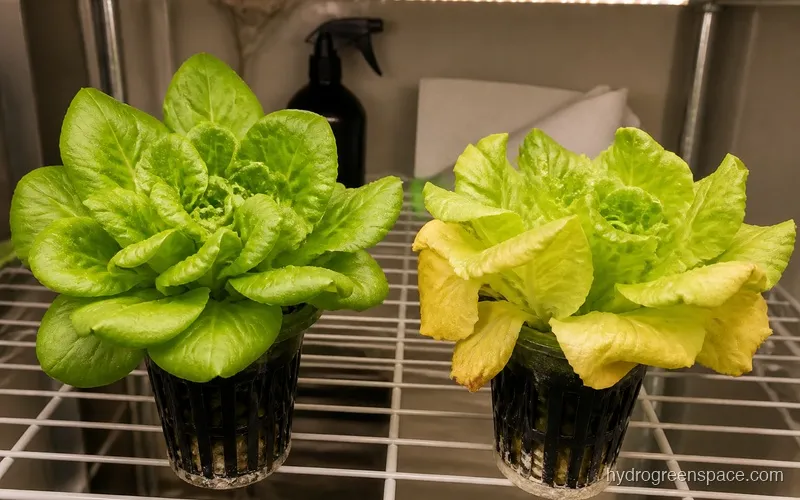
EC Is In Range But Plants Still Look Deficient
Your meter reads 2.0 mS/cm. Textbook. But your plants have yellowing leaves and slow growth.
A few causes:
pH is off. Even with perfect EC, nutrient lockout happens when pH drifts outside the absorption window (generally 5.5–6.5 for most hydroponic crops). The nutrients are present but the plant can’t take them up. Check pH first when EC looks right but plants don’t. pH fluctuation problems can tank a crop fast even when the EC number looks perfect.
Temperature is wrong. Root zone temperatures above 23°C (73°F) reduce dissolved oxygen and inhibit nutrient uptake. EC reads normal; the roots are struggling.
The EC is measuring the wrong things. EC measures total dissolved solids, but it can’t distinguish between calcium, nitrogen, iron, and sodium. If your tap water has high sodium, your EC reading is inflated by salts that provide no plant nutrition. This is why some growers use reverse osmosis water and build their nutrient solution from scratch.
Micronutrient imbalance. EC captures the bulk salts, not the trace minerals. A solution can read 2.2 mS/cm and still be deficient in iron, manganese, or zinc. If you’re seeing yellowing leaves despite correct EC and pH, a micronutrient deficiency is worth investigating.
Nutrient lockout explains how pH-induced lockout mimics deficiency symptoms at the leaf level.
EC vs. PPM: What’s the Difference?
EC (mS/cm) and PPM (parts per million) both describe nutrient concentration, but they’re not the same unit, and the conversion between them is not standardized, which causes real confusion when following manufacturer feeding schedules.
There are two common conversion scales:
- 500 scale (Hanna): 1 mS/cm = 500 ppm
- 700 scale (Truncheon): 1 mS/cm = 700 ppm
If your EC meter reads 2.0 mS/cm, that’s either 1,000 ppm or 1,400 ppm depending on which scale the meter uses. Following a brand’s ppm chart without knowing which scale it uses means you could be running 40% more or less nutrient than intended.
EC is more reliable for cross-brand comparisons because it has a fixed unit. If you’re following a brand-specific PPM feeding schedule, confirm which scale that brand uses before converting to EC.
Raising and Lowering EC in Your Reservoir
EC too high: Add plain, pH-adjusted water. Don’t add more nutrients. If EC is severely high (more than 1.0 mS/cm above your target), partial reservoir drain and refill with fresh water is faster than waiting for dilution through topping off. Nutrient burn starts showing at the leaf tips within a day or two of sustained high EC.
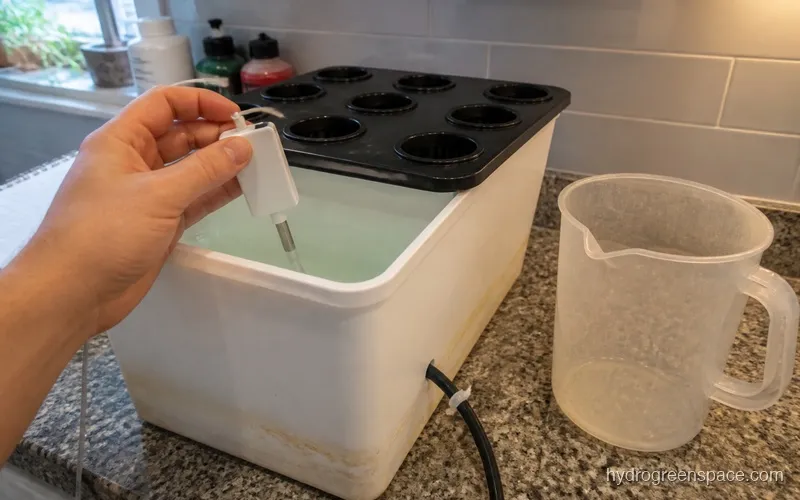
EC too low: Add a measured dose of nutrient concentrate. Mix well and retest before adding more. It’s easy to overshoot.
EC correct but plants struggling: Start troubleshooting pH, temperature, and dissolved oxygen before touching your nutrient levels. EC is only one piece of the picture when how to feed hydroponic plants is the real question.
Once you’ve got your EC ranges dialed in for your specific crops and grow stage, the next variable to nail down is choosing an accurate, reliable meter. A cheap meter that drifts by 0.5 mS/cm between readings will undermine every number in this chart. Check out the guide to the best EC meter for hydroponics when you’re ready to upgrade or replace your meter. And for a complete overview of how EC fits into your broader nutrient strategy, the hydroponic nutrients guide covers everything from choosing a nutrient type to managing your reservoir over a full grow cycle.